Markets where supply is more reasonable and less drastic will have an advantage
As a torrent of new apartments floods many U.S. markets, the question arises: which markets will best survive the inundation?
The 670,000 units expected to come online this year will far exceed the previous record of 440,000 that poured in in 2023. But supply will not be the only determinant of which metros benefit and indeed, it many areas it could prove to be a negative. Factors like job growth and consumer sentiment are far more important.
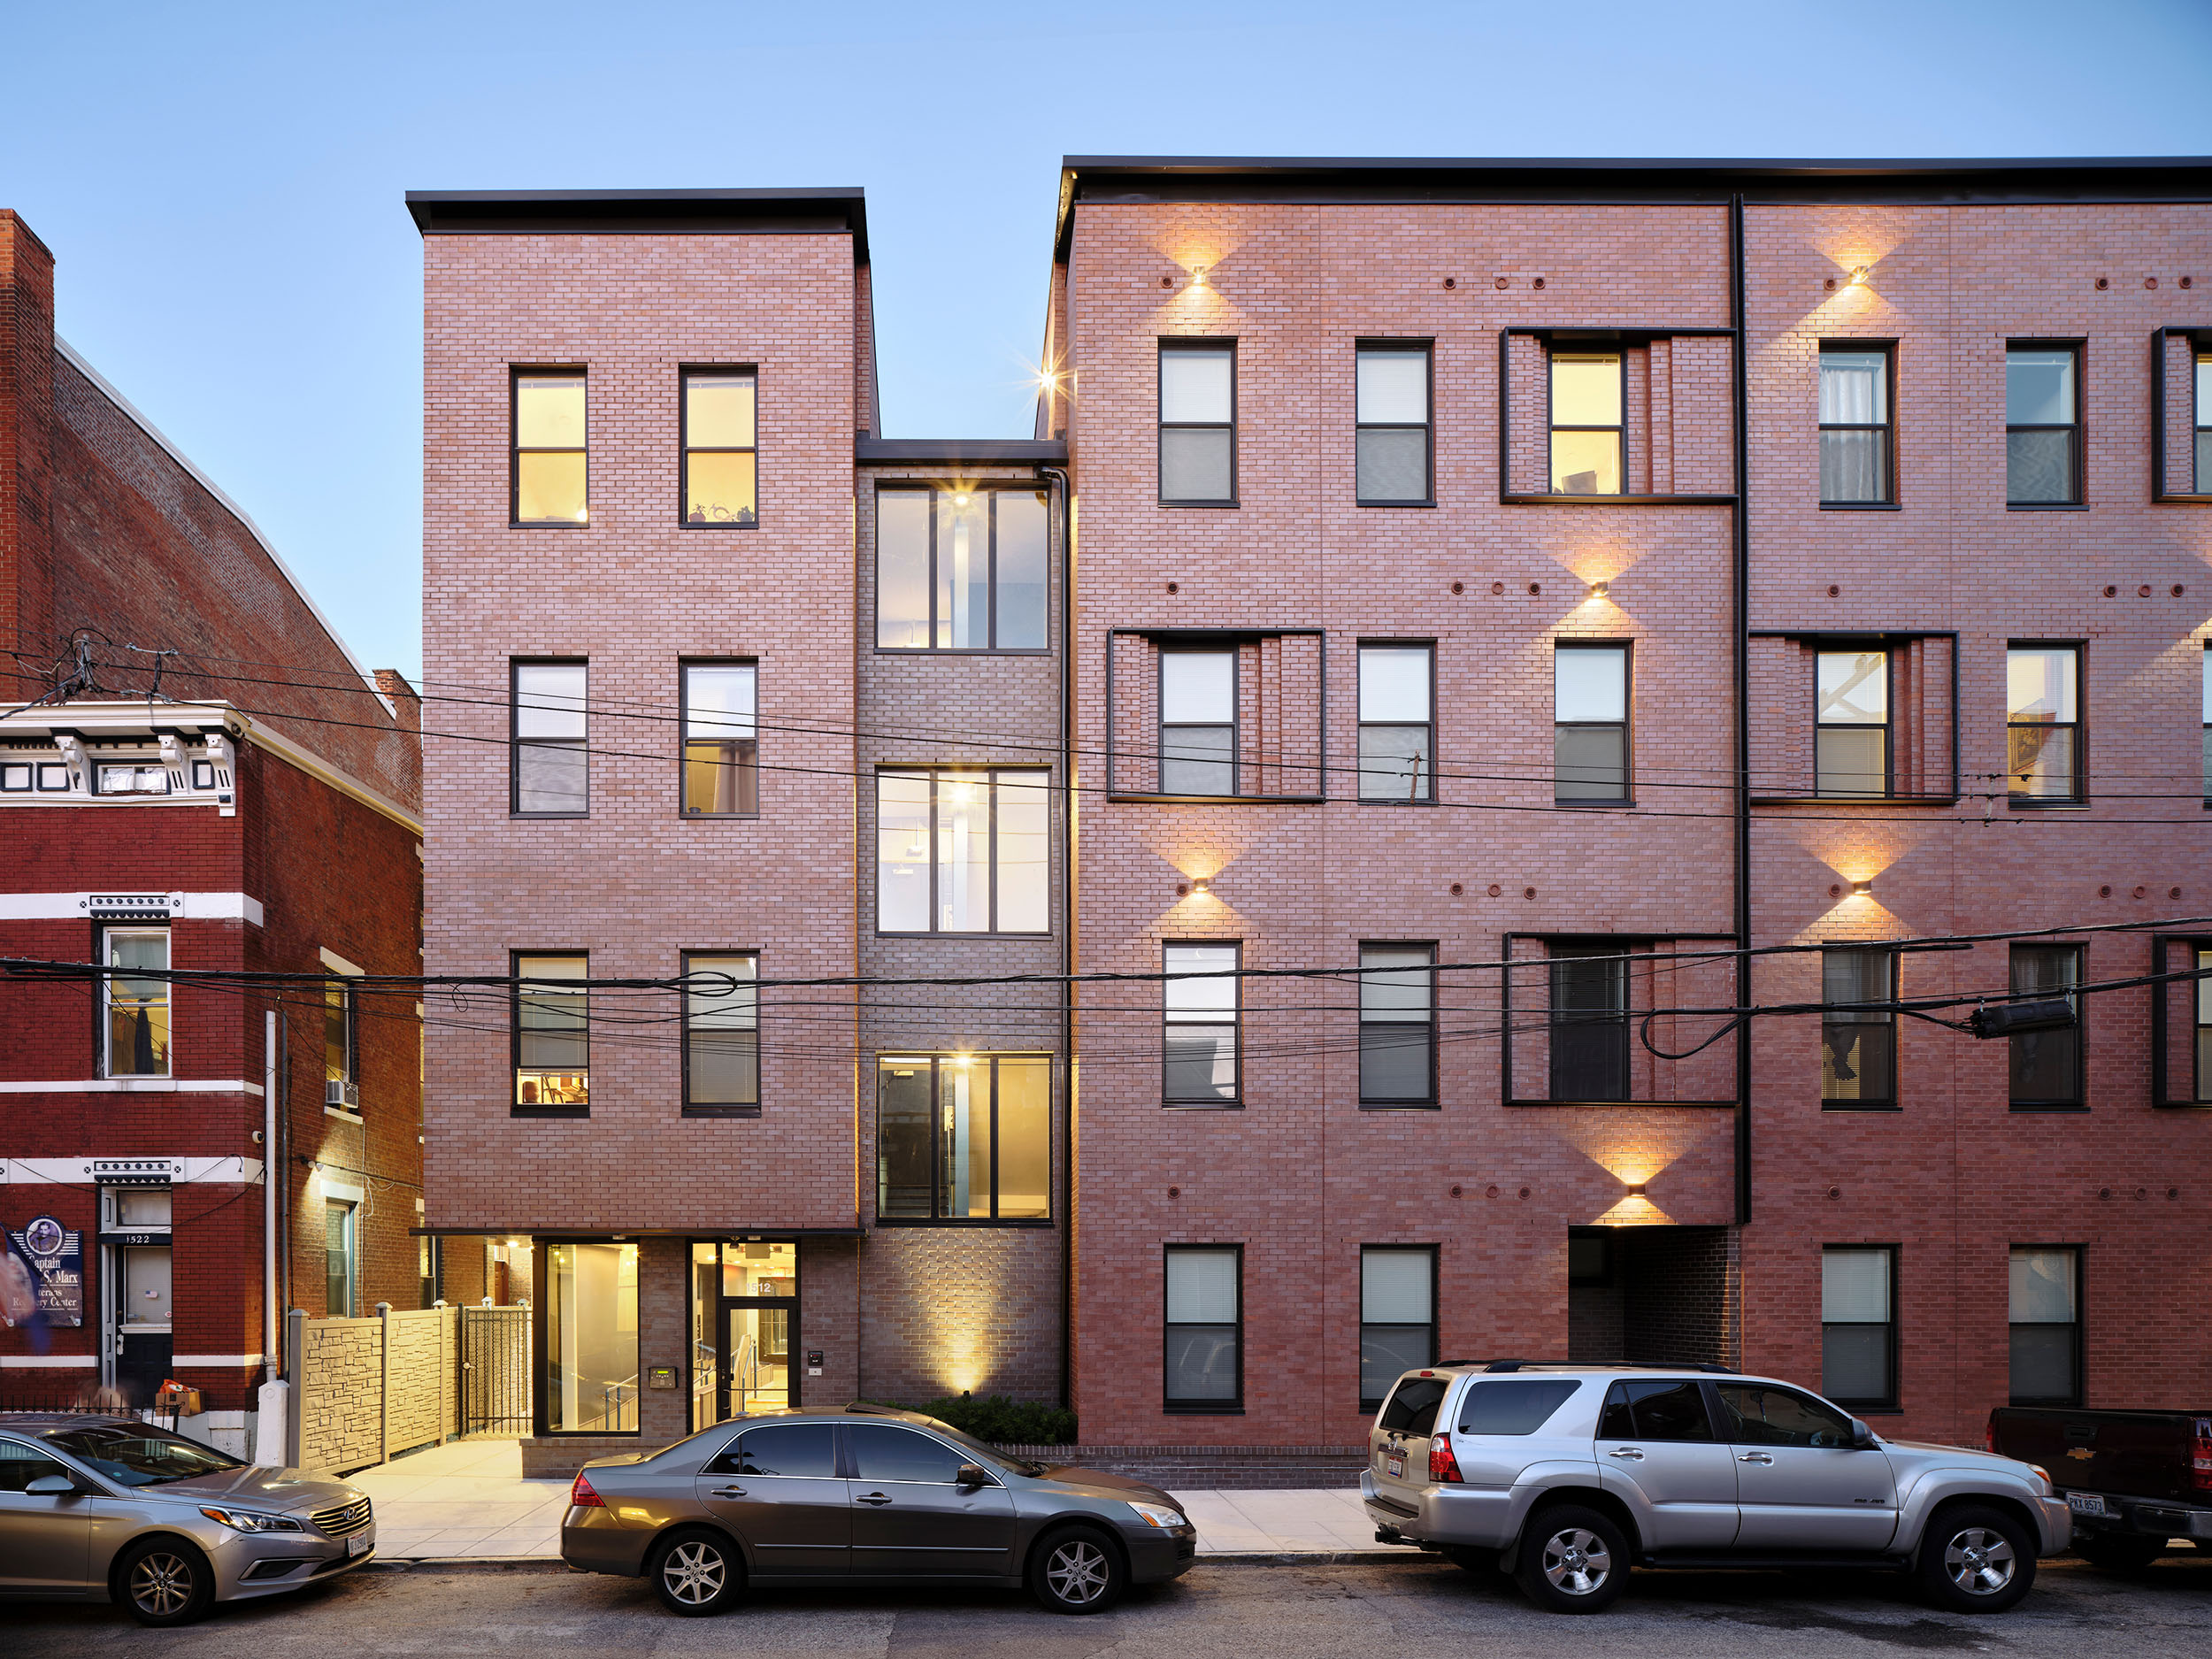
“Markets where supply is more reasonable and less drastic will have an advantage,” according to astudyby RealPage Analytics. The study tips its hat in favor of Boston, Chicago, Cincinnati, Cleveland, Columbus and New York as the biggest winners. Each saw occupancy rise above 94% in 2023 with changes in annual effective asking rents well above national levels, while construction was “reasonable” and only a modest supply hike expected in 2024.
Houston, San Diego, San Jose and in particular Washington, DC could also get a boost.
Anticipated new supply in DC is likely to be concentrated in a few key submarkets – but one-third of all its submarkets will see no new construction.
Some Western markets could potentially see higher demand, including Las Vegas, Los Angeles, Portland, San Francisco and Oakland. In 2023 these metros experienced rent cuts and not much new supply is anticipated.
Other markets show solid demand, but rent growth is expected to be limited by an influx of new inventory. These areas include Austin, Charlotte, Dallas/Fort Worth, Nashville, Orlando, Phoenix and Salt Lake City. Metros like Atlanta, Miami, Newark, Seattle and Tampa could surprise.
While public opinion and policy are shifting to support more affordable housing options, we look into 2024 to see what opportunities are in store for developers and designers.
What’s next with affordable housing? As 2023 draws to a close, GBBN’s Mary Jo Minerich and Amanda Markovic, AIA—two designers with a lot of affordable housing experience—sat down to talk about the future. What’s next in terms of trends, technology, construction? See what they say below:
“What will affordable housing look like in the coming year? Where is it taking place? Who’s doing it?”
We’re seeing affordable housing in a variety of scales and types, with increasing emphasis on sustainable design—from Passive House design to sustainably sourced material selection. The urban core is a big focus of development, though there is also clear interest in surrounding neighborhoods.
A big concern is locating housing where jobs are and figuring out the right ways to build. This is part of what it means to build a sustainable, resilient, and equitable community.
“What are some emerging trends in terms of how affordable housing is designed and constructed? How are these shaping GBBN’s approach to affordable housing?”
Design Matters. It’s encouraging to see that people are expecting affordable housing to make a strong contribution to their neighborhoods rather than just disappearing into the background behind their market rate cousins. And it’s increasingly common to see well-designed, affordable housing projects celebrated for their ability to enrich their neighborhood (see our Willkommen Design Talk).
For designers and developers, this means recognizing opportunities in affordable housing to center people’s needs holistically while responding to the local history, culture, and climate. We’re starting to see more questions about what housing can look like and the responses are far from bland or neutral. As architects, we’re asking how we can communicate the value of residents and communities with a creative approach to program, massing, and materials.
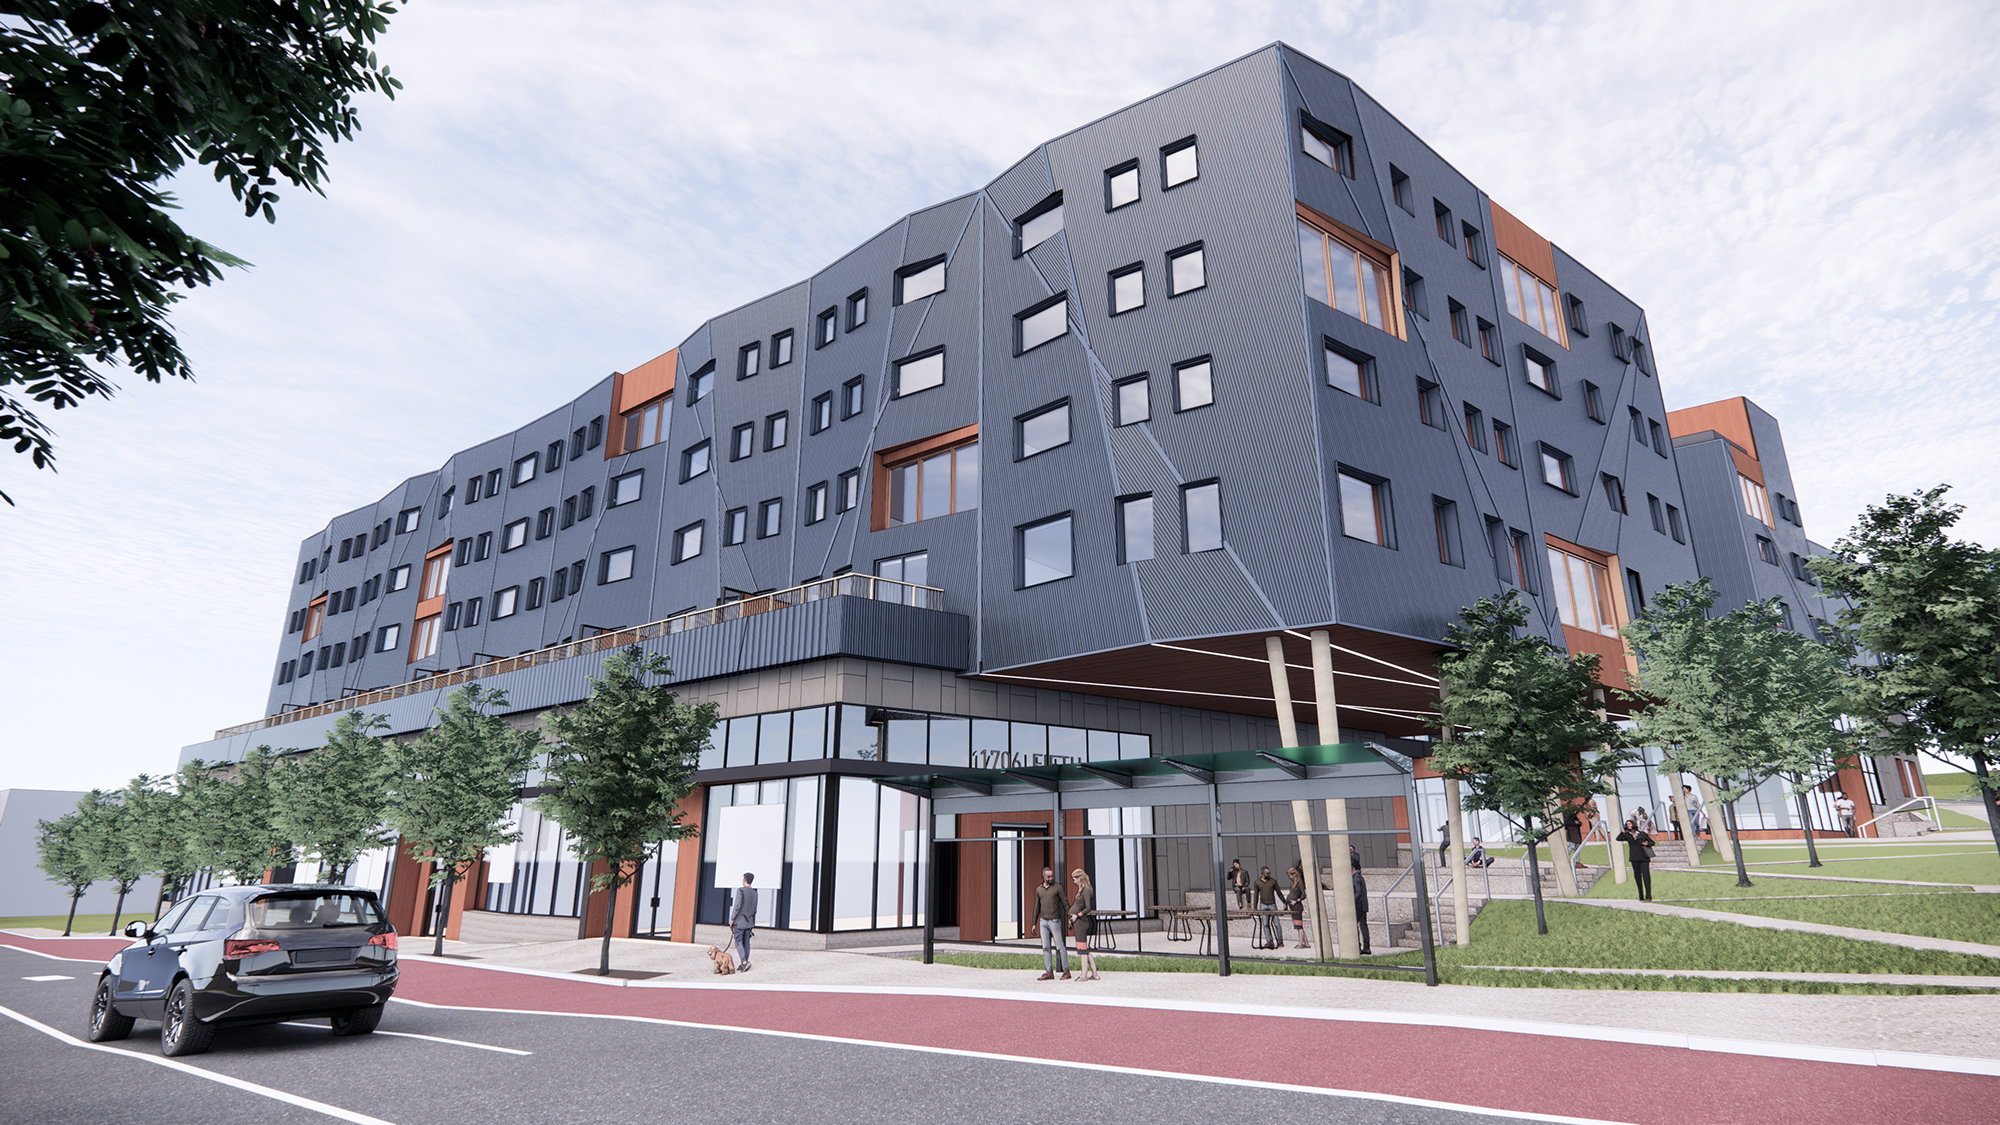
Construction. Affordable housing isn’t getting any cheaper or faster to create on its own. Fortunately, designers are figuring out how to leverage technology and craft to deliver a high level of comfort and quality at the required schedule and budget. For instance, at Fifth & Dinwiddie West, we’ve paired prefabrication with sustainable building standards such as Passive House, RESET Air, and Fitwel. Our Willkommen project brings ornamental masonry details into the 21st century with the help of Parametric Design and Augmented Reality. We think this kind of innovation will continue, with intensified focus on cutting carbon emissions and improving buildings’ environmental footprints.
Located at a Bus Rapid Transit stop, Fifth & Dinwiddie in Pittsburgh, Pa., connects residents to downtown and Oakland—and to their neighbors in Uptown and the Hill District. Rendering courtesy GBBN
“How are the economics of affordable housing changing? What does the real estate and financial landscape look like? And how are people responding?”
Looking Beyond the Building. We expect current trends of providing wraparound services at the lowest-income levels and for special needs groups to continue. However, at more moderate-income levels and in smaller buildings, we’re seeing fewer dedicated amenities. Instead, more attention is being paid to how the building positions residents as community members, with full access to neighborhood assets such as libraries, parks, recreation spaces, and transit.
At district levels, we’re seeing zoning incentives that allow greater density or parking exemptions for developments that take significant affordability and sustainability measures, which can really help a project’s bottom line.
We’re also seeing more discussion in our cities and states about the creation of local affordable housing funds, and other ways that local governments, institutions, and professional organizations can support new, small, and minority developers (especially with predevelopment costs). The results thus far are mixed. For example, a State of Ohio policy change recently disallowed the use of Low-Income Housing Tax Credits (LIHTC) and Historic Tax Credits (HTC) on the same project. That made a lot of projects harder, if not impossible. Fortunately, Ohio also created a new affordable housing tax credit program, which may mitigate some of the damage of the previous policy change. Minnesota, on the other hand, recently made a historic, $1 billion investment in affordable housing. So, the situation really depends on where you are.
Opportunities in the IRA. Finally, right now everyone is trying to understand how the Inflation Reduction Act can help fund or improve affordable housing. We recently partnered with CMTA to dig into the legislation and identify the most relevant incentives for multifamily housing. We distilled that information into an interactive tool—our IRA Calculator—which can estimate financing opportunities at stake in different sustainable design decisions. By combining affordable housing incentives with additional incentives for renewable energy, high-performing building assemblies, and other practices that prioritize sustainability, resilience, and equity, the IRA is making hundreds of thousands (if not millions) of dollars available per project.
The IRA is especially exciting because it incentivizes ambitious, holistic thinking about affordable housing. Beyond unit counts, it encourages everyone involved in affordable housing—developers, designers, local officials—to develop high-performing, comfortable housing that enriches its context and contributes to resilient neighborhoods. For those already doing that, it helps close funding gaps. For those that aren’t, it helps open a more visionary path.
Some markets are flourishing even as development nationwide slows.
Industrial starts have fallen by nearly half this year to 66.2 million square feet in the third quarter compared to 100.6 million square feet in the first quarter, according to a report from CommercialEdge. Despite the slowdown Dallas and Phoenix continue to lead in new industrial development. These two markets combined were responsible for more than 17% of all industrial starts in the nation, with Phoenix at number one.
Meanwhile rent growth is also occurring, despite the normalization of demand this year, with Southern California clocking in as the only region with double-digit rent growth. Inland Empire, Los Angeles, and Ocean County saw these increases.
The Western markets remained the most expensive in the U.S. Aside from Southern California, Seattle and Portland saw the next-largest growth in asking rents. Conversely, Denver saw the slowest growth and biggest drop in average sale prices, with a 24% decline in 2023.
Rent growth in the Midwestern markets lags behind the national trends. In fact, the leading industrial markets in that region ranked among the slowest in the U.S. Year-over-year increases in rent fell below the national rate of 7.7% in November, even in low-vacancy markets such as Columbus and Indianapolis.
Kansas City saw the largest development pipeline among Midwestern markets, followed by Indianapolis. Chicago had more than 17 million square feet of space under development in 2023. In addition, Chicago remained the leader in sales volume with 1.97 billion in transactions. The Twin Cities came in second with 917 million in sales. Overall, the Midwest registered some of the lowest sale prices year-to-date.
Dallas-Fort Worth leads the South in development and sales volume. Nashville and Charlotte had the lowest vacancy rates in November among the top Southern markets, with Atlanta following. Tampa had the highest vacancy rate in the region as well as the slowest rent growth in the region. Houston saw the slowest growth rate nationwide at 4.1%.
Miami’s activity was significant in the South, with industrial rents rising 9.3%. This brought the average in-place rent to $10.46 per square foot. In addition, new leases signed over the past 12 months averaged $16.02 per square foot.
In the Northeast, there was an increase in vacancies in New Jersey, but the state remained one of the strongest markets in the nation. In-place rents in the state grew 9.1% year-over-year to $10.06 per square foot. At the same time, New Jersey saw $2.53 billion in industrial sales.
Gen Z and Millennials have their differences when it comes to lifestyles – and also regarding preferred places to live.
Both groups are part of the trend that has put interstate moving at an all-time high, with a record-breaking 8.2 million Americans making the move across state lines in 2022, according to Storage Café.
Conversely, same-state relocations plummeted over the last decade, from 37.8 million Americans involved in local moves in 2013 to just 31 million in 2022.
Millennials (aged 24 to 39) represent the largest cohort (34%) of those moving out of state, typically seeking a “better” home and a “thriving” job market, according to the report, often in the South.
Texas saw a net influx of over 75,000 millennials in 2022, making it the top choice for young professionals, while Georgia emerged as the runner-up, welcoming a net gain of 36,000 millennials. Florida ranked a close third in net migration.
Gen Zers are the second-most mobile generation in the US, and they are choosing to avoid major urban hubs such as Los Angeles and New York City, instead opting for locations where they can solidify their career paths and streamline life expectations.
Connecticut and Washington, D.C., top that list as they offer higher incomes, on average,
“Impressively, the influx of 13K young people that DC experienced in 2022 represents almost a quarter of the District of Columbia’s total Gen Z population,” according to the report.
As the first digitally native generation, Gen Zers are more comfortable with fully remote working. Their approach to work-life balance and their lifestyle preferences opens them up to a wider range of potential places to call home and might even influence the migration status quo currently seen flowing mainly towards Southern hotspots.
DC is home to the largest cohort of remote workers in the US – roughly 23% of the local talent pool – appeals to this group. Connecticut has 14% of its workers doing so remotely.
Gen Z also seeks a slower pace of life, according to the report, and North Carolina, Texas, Utah, and Pennsylvania provide that.